


Spectrum Analyser
The Spectrum Analyser allows you to observe input signals in the frequency domain, it takes a voltage that varies in time and splits it into its constituent sine waves highlighting the predominant frequencies.
Below is the Spectrum Analyser’s user interface showcasing some of the key features explained below:
Key Features of the Spectrum Analyser:
High Bandwidth Inputs
Display and record power spectra or power spectral densities in the frequency domain within the hardware’s frequency range:
- Moku:Go – DC to 30 MHz
- Moku:Lab – DC to 250 MHz
- Moku:Pro – DC to 300 MHz
Measurement Markers
Quickly track key metrics, such as spectral power, with ease by dragging up to four measurement cursors onto features of interest using the intuitive interface. Real-time and historical data of peaks, frequency, and power trends are all available. They can be snapped onto a peak to track maximum values.
Optimised for Efficiency
The Spectrum Analyser streamlines your workflow with the combination of measurement markers and the effortless exportation of data to Dropbox, iCloud and email. The intuitive and easy-to-use user interface brings a new level of user friendliness.
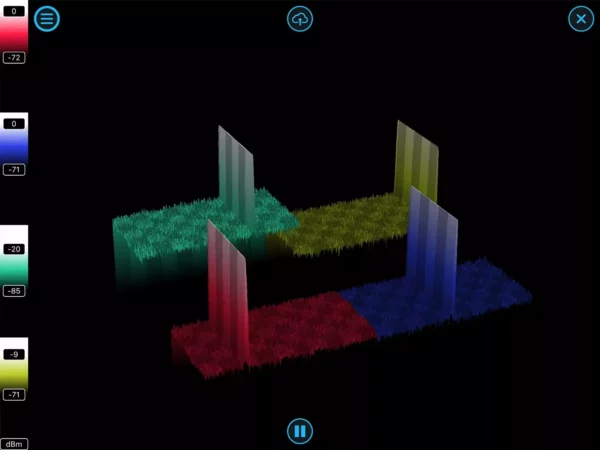
The evolution of a spectrum can be easily viewed with the 3D waterfall plot, shown below.
Finer Resolution Bandwidth
A hybrid super-heterodyne FFT approach ensures maximum resolution bandwidth, even at higher frequencies, while maintaining the measurement speed.
API Support
Python, MATLAB, and LabVIEW integrations are available for advanced programming support.
Applications:
- Frequency domain analysis
- System response characterization
- RF system design
- Spurious signal identification
- Noise measurement