


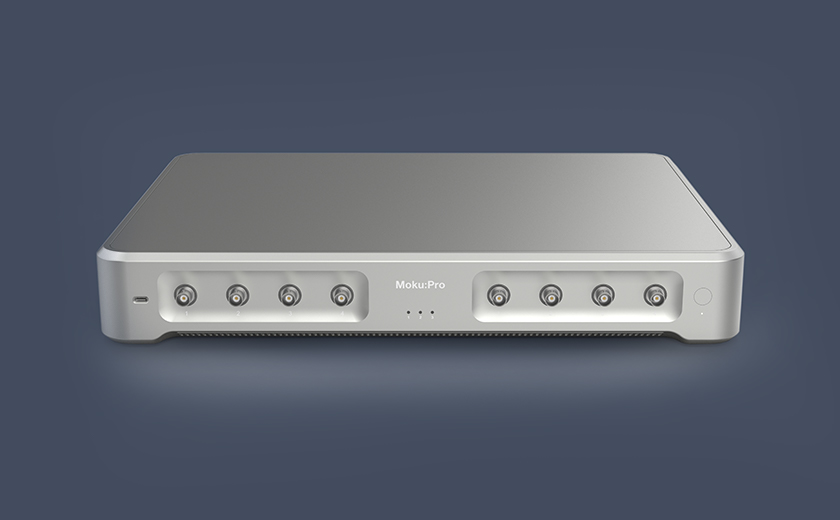
Oscilloscope
The Moku Oscilloscope features up to four high-speed, ultra-low-noise input channels with an analog bandwidth of up to 600 MHz and a sample rate of up to 5 GSa/s.
For maximum flexibility, we offer 12-bit or fully integrated 10-bit and 18-bit blended ADCs to cover a broad spectrum, providing class-leading input noise performance of 30 nV/√Hz at 100 Hz with a high dynamic range.
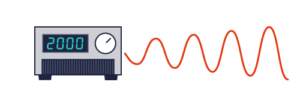
Leverage the built-in four-channel Waveform Generators to quickly produce various waveforms with a maximum bandwidth of 500 MHz.
Below is the Oscilloscope’s user interface showcasing some of the key features explained below:
Key Features of the Oscilloscope:
Easy-to-use, high-performance oscilloscope measurements
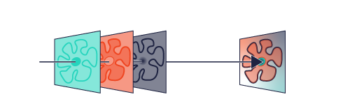
Built on a powerful Xilinx FPGA, the Moku Oscilloscope delivers the ultimate combination of versatility and performance. With a high-quality analog front end, the Oscilloscope makes signal monitoring more intuitive than ever before.
With Moku:Pro, our blended ADC technology lets you measure with class-leading input noise performance of 30 nV/√Hz at 100 Hz and a high dynamic range.
Unlock greater insights with fully integrated Waveform Generators
Stimulate a system and measure its response simultaneously with up to four integrated Waveform Generators, capable of producing sine waves at up to 500 MHz, and square, triangle, and pulse waves at up to 150 MHz.
Automatic and manual measurement options for maximum flexibility
Select from a wide range of preset measurements, including a variety of visualization tools including measurement trends and histograms. Add draggable cursors to set custom measurements for voltage or time between points.
Configurable math channel for total customisation
Customise your measurements and perform real-time math operations such as addition, subtraction, multiplication, division, and FFT with support for arbitrary functions.
Engineered to work seamlessly with your preferred APIs
API integration with Python, MATLAB, and LabVIEW allows straightforward automation of your Moku device in complex setups or for repetitive tasks. Save your measurements, screenshots, traces, and other settings locally or to your preferred cloud app. You can also send work to yourself or colleagues within the Moku app.
Applications:
- Automated system test
- Circuit design and characterisation
- Jitter/clock analysis
- Automated system test
- Signal monitoring and analysis
- System test and debug