


































What Is Hyperspectral Imaging? The Complete Guide
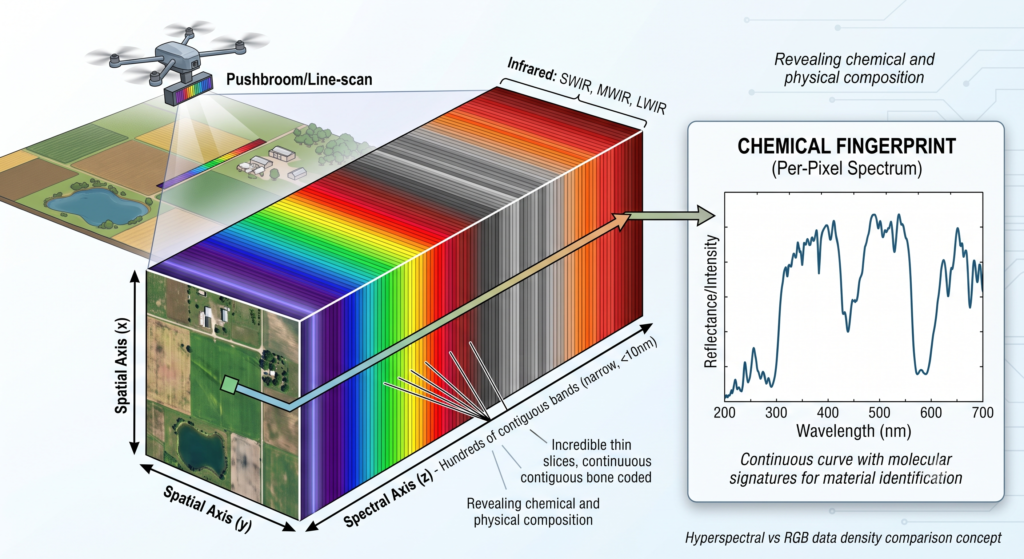
Hyperspectral imaging is an imaging technique that captures a full spectrum of light — often hundreds of narrow, contiguous wavelength bands — for every pixel in an image, rather than just the red, green, and blue bands a standard camera records. The result is a three-dimensional data cube (two spatial dimensions plus one spectral dimension) that reveals the chemical and physical composition of a scene, not just its appearance.
Below, we cover how the technology actually works, how it compares to multispectral and RGB imaging, the different types of hyperspectral systems on the market, where it’s used across industry and research, and what to think about if you’re specifying a system for your own application.
How Hyperspectral Imaging Works
A standard digital camera sorts incoming light into three broad channels — red, green, and blue — and reconstructs an image the way the human eye perceives colour. A hyperspectral imaging system does something fundamentally different: it uses a spectrometer built into the imaging path (a component often called an imaging spectrograph) to split incoming light into dozens or hundreds of narrow, contiguous wavelength bands before it reaches the detector.
The output isn’t a single 2D image — it’s a hyperspectral data cube: two spatial axes (x and y, describing position in the scene) and one spectral axis (describing intensity at each wavelength). Every pixel in that cube carries its own continuous spectrum, effectively a chemical fingerprint of whatever material sits at that point in the image.
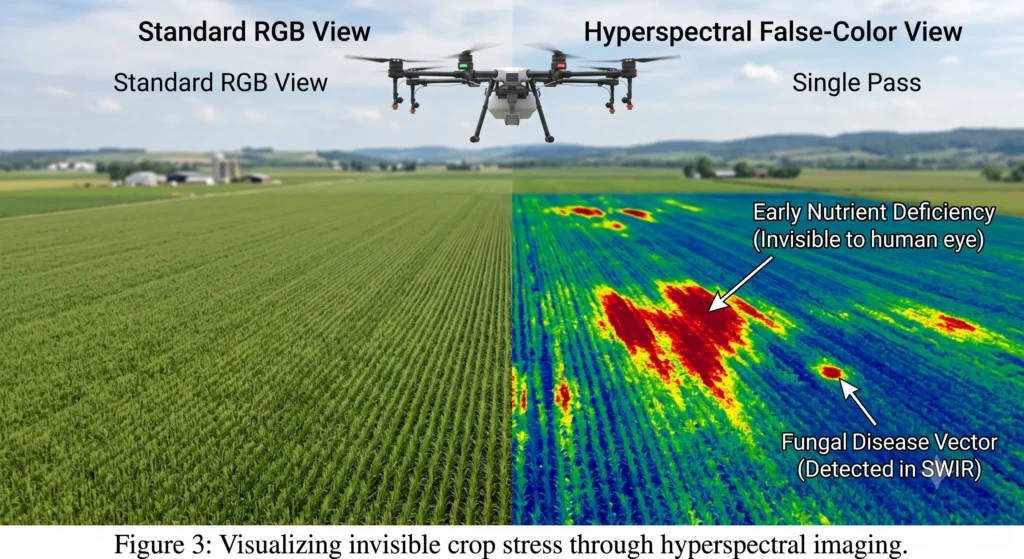
Because different materials absorb, reflect, and emit light differently at different wavelengths, that per-pixel spectrum can be matched against reference libraries to identify what a material is — not just what it looks like. This is what allows hyperspectral imaging to distinguish between two visually identical plastics, detect early-stage plant stress invisible to the naked eye, or separate genuine pharmaceutical tablets from counterfeits without opening the packaging.
Hyperspectral vs. Multispectral vs. RGB Imaging
These three terms get used interchangeably, but they describe meaningfully different levels of spectral detail:
| Bands captured | Band width | Typical use | |
|---|---|---|---|
| RGB imaging | 3 (red, green, blue) | Broad | Standard photography, machine vision colour sorting |
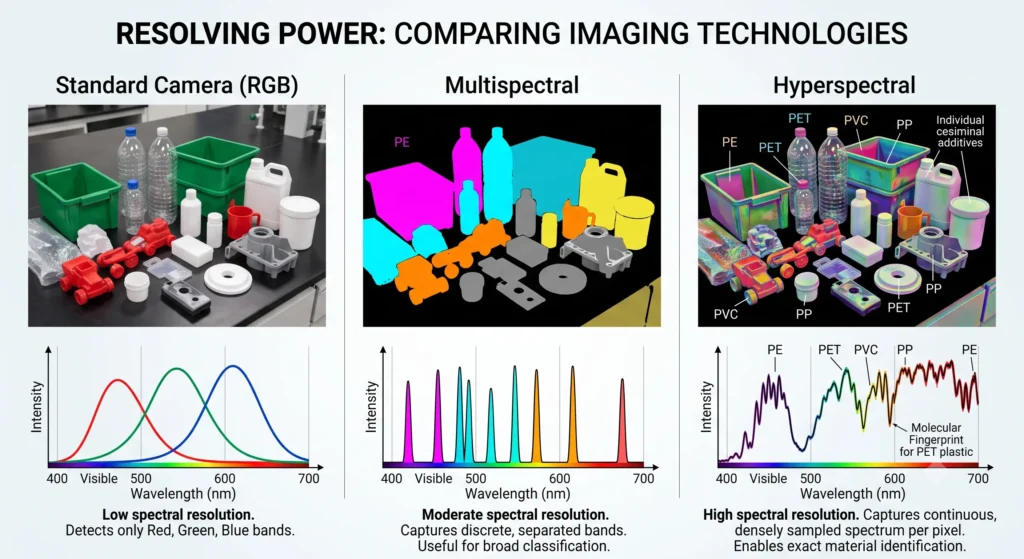
| Multispectral imaging | ~4–15 discrete, often non-contiguous bands | Moderate to broad | Remote sensing, satellite imagery, basic crop health (NDVI) |
| Hyperspectral imaging | Tens to hundreds of contiguous, narrow bands | Narrow (often <10 nm) | Material identification, chemical composition, trace detection |
The practical difference is resolution of information, not just band count. Multispectral imaging tells you a plant is stressed; a hyperspectral system can often tell you why — nutrient deficiency, water stress, or early disease — because it’s sampling the spectral curve densely enough to separate signatures that would blur together in a multispectral dataset.
The Wavelength Ranges Hyperspectral Systems Cover
Hyperspectral isn’t limited to visible light. Depending on the application, systems are built to cover:
- UV–VIS (200–400 nm): fluorescence and photoluminescence-based material identification
- VNIR (400–1,000 nm): the most common range for remote sensing, agriculture, and sorting applications
- SWIR (1,000–2,500 nm): mineral identification, moisture content, plastics sorting
- Mid-infrared / MWIR (3–8 µm): molecular vibrational fingerprinting — chemical bonds absorb strongly and specifically here, making this range especially powerful for chemical identification rather than just classification
- LWIR / thermal (8–15 µm): gas detection, thermal signature analysis
This last point matters more than most introductory guides let on. Visible-to-SWIR systems are good at telling materials apart. Mid-infrared hyperspectral systems, because they’re probing molecular vibrational bands directly, can tell you the actual chemical identity of a compound — which is why laser-based mid-IR imaging has become the instrument of choice in pharmaceutical analysis, forensics, and materials science, rather than the visible-range cameras most “what is hyperspectral imaging” explainers focus on.
Types of Hyperspectral Imaging Systems
Hyperspectral instruments are generally built around one of a few acquisition methods:
- Pushbroom (line-scan): captures one spatial line at a time with the full spectrum for that line, building an image as the sample or sensor moves. Common in conveyor-belt sorting and drone/aerial remote sensing.
- Whiskbroom (point-scan): captures a single spectrum per point, scanned across the scene. Slower, but very high spectral fidelity.
- Snapshot / staring array: captures the full spatial and spectral data cube in a single exposure. Better suited to dynamic scenes or lab microscopy where the sample or subject can’t be moved past the sensor in a controlled way.
- Laser-based / tunable source imaging: rather than passively capturing ambient or reflected light, the system illuminates the sample with a tunable laser source (commonly a quantum cascade laser, or QCL) stepped across the spectral range, then images the response at each wavelength. This approach is particularly effective in the mid-infrared, where it delivers high signal-to-noise and fast acquisition without the need for a cooled detector array.
Applications of Hyperspectral Imaging
- Pharmaceutical quality control: verifying tablet coating uniformity, active ingredient distribution, and detecting counterfeit medicines without destructive sampling
- Food safety and sorting: detecting contamination, bruising, and foreign material, and grading produce by ripeness or fat/moisture content
- Agriculture and precision farming: early detection of crop stress, disease, and nutrient deficiency, often from drone-mounted systems
- Recycling and waste sorting: separating plastics, paper grades, and other materials at high speed by chemical composition rather than colour or shape
- Mineral exploration and geology: mapping mineral composition and ore grade across large survey areas
- Forensics and security: trace chemical detection, identifying substances such as explosives, narcotics, or gunshot residue in situ
- Art conservation and cultural heritage: analysing pigments and materials non-destructively to inform restoration and authentication
- Environmental monitoring: tracking vegetation health, water quality, and land-use change over time
- Materials research: semiconductor wafer inspection, polymer characterisation, and failure analysis
Choosing a Hyperspectral Imaging System: What to Consider
If you’re specifying a system rather than just researching the concept, the questions that actually determine which instrument is right for your application are:
- What wavelength range does your target material actually respond in? VNIR is cheaper and more common, but if you need molecular specificity rather than just classification, mid-IR is usually the better fit.
- Do you need a desktop/lab instrument, a handheld device for in-situ measurement, or a system integrated into a production line? These have very different form factors, acquisition speeds, and cost profiles.
- Snapshot or scanning? If your sample is static (a microscope slide, a lab sample), scanning acquisition gives you higher spectral resolution. If it’s moving (a conveyor belt, a drone survey), you need pushbroom or snapshot.
- Do you need chemical identification or just classification? This is the single biggest factor in whether a VNIR/SWIR system will suffice or whether you need a mid-IR, laser-based instrument.
- What software and chemical ID libraries come with the system? The hardware captures the data cube; the software is what turns it into an answer.
Hyperspectral & Spectroscopy Instruments from Laser 2000
Laser 2000 supplies hyperspectral and spectroscopy instrumentation built around laser-based mid-infrared imaging, in partnership with DRS Daylight Solutions and Photon Systems:
- Spero® IR hyperspectral imaging microscopes — laser-based chemical imaging combining mid-infrared vibrational spectroscopy with wide-field, high-resolution imaging, available as the Spero-QT 340 and the lower-cost Spero-LT 340
- ChemDetect™ — a fully integrated spectrometer combining broadly tunable QCL technology with embedded chemical ID algorithms for real-time, in-situ trace chemical detection
- Handheld DUV fluorescence & Raman systems, DUV photoluminescence spectrometers, and a chemical printer & mapper for generating known reference concentrations
Browse the full range on our Spectroscopy & Hyperspectral Imaging category page, or see the IR Hyperspectral Imaging systems specifically.
Frequently Asked Questions
What is hyperspectral imaging used for? Hyperspectral imaging is used to identify and quantify the chemical and physical composition of materials — in pharmaceutical quality control, food safety and sorting, agriculture, recycling, mineral exploration, forensics, art conservation, and materials research.
How is hyperspectral imaging different from multispectral imaging? Hyperspectral imaging captures tens to hundreds of narrow, contiguous spectral bands per pixel, versus roughly 4–15 broader, often non-contiguous bands for multispectral imaging. The extra spectral density lets hyperspectral systems distinguish materials that would look identical under a multispectral or RGB camera.
Does hyperspectral imaging only work in visible light? No. Hyperspectral systems are built across UV, visible, near-infrared, shortwave infrared, and mid-infrared ranges. Mid-infrared systems, often laser-based, are particularly effective for chemical identification because they probe molecular vibrational bands directly.
What’s the difference between a hyperspectral camera and a hyperspectral imaging system? “Hyperspectral camera” usually refers to the imaging sensor and spectral-splitting optics alone. A full hyperspectral imaging system includes the camera, light source or illumination method, motion/scanning stage where relevant, and the software used to process the resulting data cube into usable results.
Is hyperspectral imaging destructive to the sample? No — hyperspectral imaging is non-contact and non-destructive. It’s one of the main reasons it’s used for pharmaceutical, food, and cultural heritage applications where the sample can’t be altered or consumed during analysis.